How to Summarize Graphs and Hypergraphs

Networks are everywhere: when it comes to people, proteins and brain regions – just to name a few examples – considering individuals without their interactions gives you just one side of the coin, or even less. Network data include these precious interactions, but are often more than big: they are huge. Just think that the three million people living in the metropolitan area of Milan can establish trillions (millions of millions) of possible interactions. Luca Trevisan, Full Professor of Computer Science at the Department of Decision Sciences and BIDSA Fellow, has recently published an article about algorithms that allow to summarize these data structures, thus making them treatable, while preserving the information they contain.
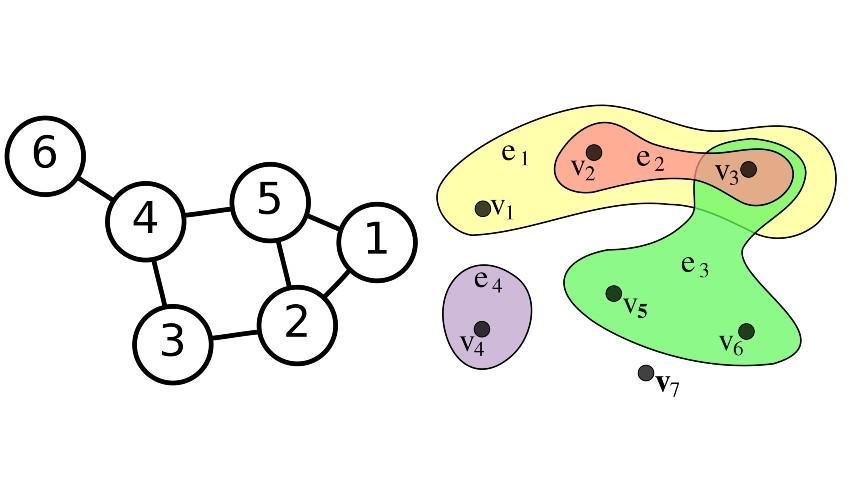
From a mathematical point of view, networks can be represented as graphs, which consist of a set of vertices (or nodes), representing individuals, and a set of edges (or links), each joining a couple of vertices and representing an interaction among the corresponding individuals. Hypergraphs generalize this construction allowing an edge to join any number of vertices, and can be used to represent more complex connectivity patterns. The memory required to store a graph and the time needed to run an algorithm on it often depend on the number of edges. In the case of a graph with many edges (a dense graph) the number of edges can be of the order of the square of the number of vertices. This makes dense graphs costly to handle, both in terms of memory and computational time.
Sparsification techniques address this problem by substituting the original graph with a graph that has fewer edges (over the same set of nodes) but preserves some relevant features of the original graph. One trivial sparsification strategy consists in randomly discarding some of the original edges. This generally does not work, because – depending on the graph property to be preserved – some edges are more important than others. For example, consider a graph where nodes are clearly clustered in communities and nodes in the same community are very densely connected, while very few edges connect different clusters. If you want to preserve the graph distance (that is the number of edges to cross in order to get from one vertex to another), then the edges joining different communities are much more important than those within the same community. Hence we need something more elaborate than randomly sampling the edges to discard.
As for graphs, this problem has received a lot of attention over the years and several sparsification algorithms are available. Unfortunately, existing methods for graphs cannot be simply extended to hypergraphs.
«The reason», explains Trevisan, «is that the mathematics behind graphs (matrices and linear algebra) is different from that behind hypergraphs, which involves more complex mathematical objects called tensors. Hence, we need to design new techniques for graphs that are extensible to hypergraphs. In this sense, I see sparsification as a testing ground for re-thinking graph algorithms».
This approach has earned Trevisan a prestigious 5-year Advanced ERC Grant, started in 2019.
«The first year under this grant has already produced exciting results», says Trevisan, «and we are confident that the future will yield further advancements. This is a really interesting research area that stands at the crossroads of mathematics and computer science, thus hopefully benefitting both of these worlds».
N. Bansal, O. Svensson e L. Trevisan, “New notions and constructions of sparsification for graphs and hypergraphs", in 2019 IEEE 60th Annual Symposium on Foundations of Computer Science (FOCS).
Images:
By Hypergraph.svg: Kilom691derivative work: Pgdx (talk) - Hypergraph.svg, CC BY-SA 3.0, https://commons.wikimedia.org/w/index.php?curid=10687664
By User:AzaToth - Image:6n-graf.png simlar input data, Public Domain, https://commons.wikimedia.org/w/index.php?curid=820489
by Sirio Legramanti — source: Bocconi Knowledge
